Estimated Output
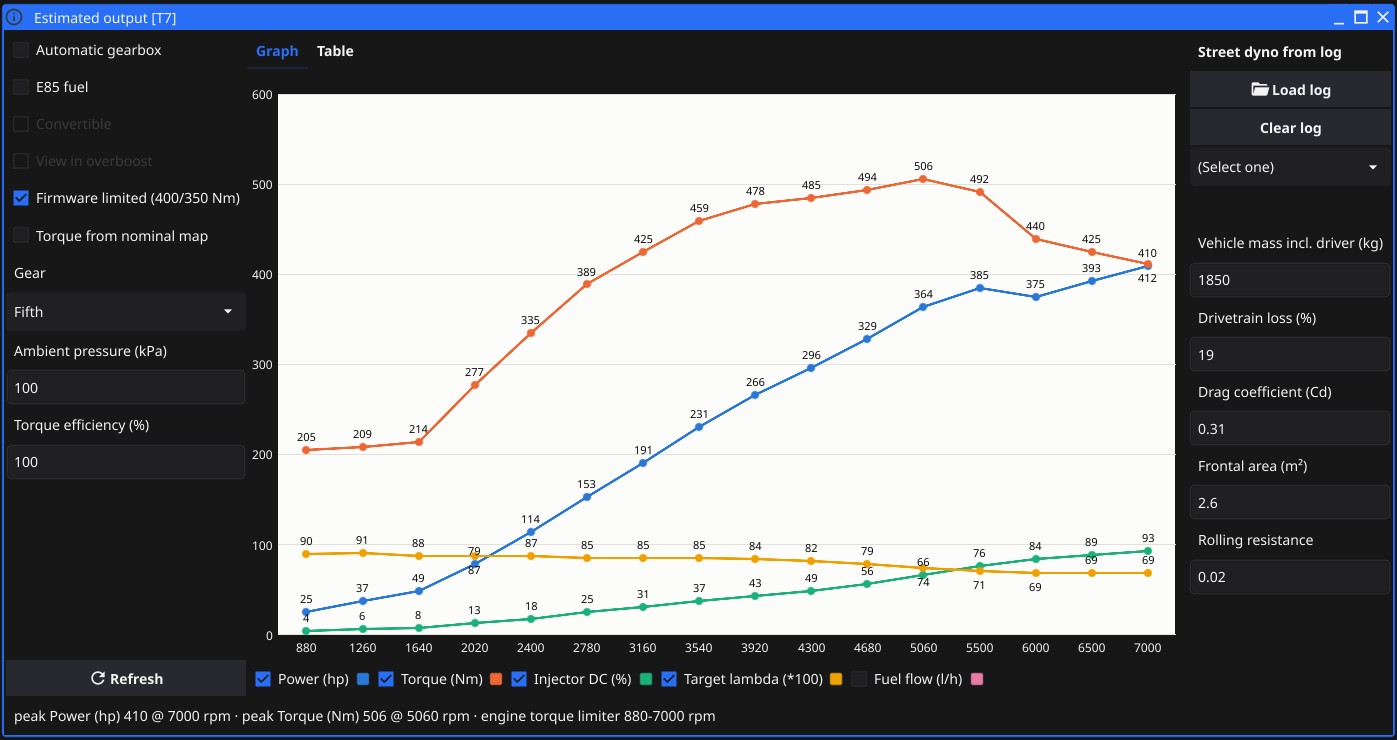
The “Estimated output” tool has two independent halves that share one graph:
- Estimate from the binary — reads the calibration maps out of the currently loaded firmware and plots what the ECU would allow at WOT. Math ported from T5Suite’s “Show dyno graph” and T7/T8Suite’s “Airmass result viewer”.
- Street dyno from log — takes a recorded log, finds the WOT pull in it, and computes what the car actually did from dv/dt.
Both draw onto the same RPM axis (the axis comes from the binary), so a measured pull can be laid straight on top of the estimate. Every curve is toggleable in the legend above the graph; the summary line under the graph reports the peak of the curves flagged as peak-worthy plus the RPM spans where a limiter was active.
Which ECU family you get is decided by the ECU selected in txlogger — T5, T7 and T8 have
estimators; anything else shows “No output estimator for ECU …”.
An option is greyed out when the loaded binary does not contain the map that option needs. The “Refresh” button re-runs everything against the binary as it is right now — use it after editing a map so the estimate follows the change.
The source lives in pkg/widgets/estimatedoutput.
Section 1 — Estimate from the binary
How it works
T7 / T8 follow the ECU’s own request chain:
pedal position ──► pedal request map ──► [T8: torque → airmass] ──► torque limiters
                                                                 ──► airmass (knock) limiter
                                                                 ──► turbo speed limiter (T7)
                                                                 ──► fuel-cut limiter
                                                                 ──► limited airmass (mg/c)
limited airmass ──► torque ──► power, injector DC, target lambda, fuel flow, EGT (T8)
The whole pedal × RPM grid is evaluated, not just WOT: the Table tab shows the resulting limited airmass for every cell (highest pedal position on the top row, like the suites), with a coloured corner marker naming the limiter that clipped that cell. The Graph tab plots the WOT column only.
On T7 the pedal map already holds airmass, so the request goes straight into the limiter chain.
On T8 the pedal map holds torque in 0.1 Nm, which is converted to airmass through
TrqMastCal.m_AirTorqMap first.
Torque from airmass is either the simple model airmass / 3.1, ×1.07 for E85, times a fixed
high-RPM roll-off (1.00 below 5060 rpm, 0.99, 0.95, 0.94, 0.85 at ≥6000 rpm), or the binary’s
nominal torque map if you tick that option. Power is torque × rpm / 7024 in whole hp, using
integer division exactly like the original suites, so the curve steps in 1 hp increments. Note 7024
is the metric hp (PS) constant (60·735.5 W/2π); the curves are labeled plain “hp” accordingly —
multiply by 0.986 if you want true brake hp.
T5 has no torque model in the binary, so it works off boost instead: it reads the WOT column of
the boost request map (Tryck_mat! or Tryck_mat_a!), converts it to gauge bar, and looks torque
up in a fixed torque-vs-boost table per turbo family. The Table tab is the boost request in bar over
throttle × RPM. Injector DC replays the T5 firmware’s own injection-time math at a fixed ~20 °C
intake temperature and 13.0 V battery.
If a required symbol is missing you get one error naming every missing symbol at once, rather than a silent wrong answer.
T7 inputs
| Input | What it is | Effect on the result |
|---|---|---|
| Automatic gearbox | Selects the automatic calibration set. | Uses TorqueCal.M_EngMaxAutTab instead of M_EngMaxTab, BstKnkCal.MaxAirmassAu instead of MaxAirmass when present, drops the per-gear limiters entirely, and (with firmware limit on) lowers the hard cap from 400 to 350 Nm. Usually a visibly lower torque plateau. |
| E85 fuel | Car runs E85. Disabled if the binary has no TorqueCal.M_EngMaxE85Tab. | Switches the torque limiter to the E85 table (or M_EngMaxE85TabAut on automatics), the VE map to BFuelCal.StartMap, stoich AFR from 14.65 to 9.84, fuel density 0.742→0.775, and multiplies estimated torque by 1.07. Torque and power go up, injector DC and fuel flow go up a lot. |
| Convertible | Applies the convertible per-gear torque limit TorqueCal.M_CabGearLim. Disabled if absent. | An extra, usually lower, ceiling on top of the normal gear limit. Manual gearbox only. |
| View in overboost | Show the transient overboost ceiling rather than the steady-state one. Disabled unless TorqueCal.EnableOverBoost is non-zero. | Torque limit comes from M_OverBoostTab, normally higher than M_EngMaxTab, so peak torque rises. This is what the car does for the few seconds overboost is granted, not what it holds. |
| Firmware limited (400/350 Nm) | The hardcoded ECU/TCM ceiling. On by default. | Caps torque at 400 Nm manual / 350 Nm automatic before the map limiters are applied. Untick to see what the maps alone would allow — useful for judging a tune whose maps ask for more than the firmware will give. |
| Torque from nominal map | Take torque from TorqueCal.M_NominalMap instead of airmass / 3.1. | Uses the binary’s own airmass→torque calibration. Usually the more trustworthy number on a stock-ish binary; on a heavily modified one the nominal map is often left untouched and then it lies. |
| Gear | Reverse … Fifth. Manual only (ignored when Automatic is set). | Selects the row in TorqueCal.M_ManGearLim, plus the RPM-dependent M_1GearTab in 1st and M_5GearLimTab in 5th. Lower gears are typically limited harder, so 1st shows a much flatter torque curve than 5th. Default is 5th — the least restricted case. |
| Ambient pressure (kPa) | Barometric pressure for the turbo speed limiter. Default 100. Values outside 50–150 fall back to 100. | Feeds LimEngCal.TurboSpeedTab (indexed by pressure) × TurboSpeedTab2 (indexed by RPM). Lower pressure = higher altitude = lower airmass ceiling, so the curve drops off at altitude. No effect if the binary has no turbo speed tables. |
| Torque efficiency (%) | A pure fudge factor on the estimate. Default 100. Outside 10–300 it is treated as 100. | Scales estimated torque and power only. The limiter chain and all fuel math still use the binary’s own maps and are untouched. Use it to calibrate the estimate against a real dyno or a street-dyno pull — that’s the knob, not the model. |
T8 inputs
Same as T7 except as noted:
| Input | What it is | Effect on the result |
|---|---|---|
| Automatic gearbox | Automatic calibration set. | TrqLimCal.Trq_MaxEngineAutTab*, BstKnkCal.MaxAirmassAu, and the TCM limit TMCCal.Trq_MaxEngineTab / Trq_MaxEngineLowTab. Per-gear limits are skipped. Firmware cap 350 Nm instead of 400. |
| E85 fuel | Biopower. Disabled unless the binary has an FFTrqCal.FFTrq_MaxEngineTab*. | Torque limiter from FFTrqCal.FFTrq_MaxEngineTab*, airmass limiter from FFAirCal.m_maxAirmass instead of BstKnkCal.MaxAirmass, VE map from FFFuelCal.TempEnrichFacMAP, AFR 9.84, torque ×1.07, and the EGT estimate drops 50 °C. |
| High output (175/210 hp) | Which of the two engine variants the binary is calibrated for. On by default. | Picks table 1 (high output) or table 2 (low output) for every engine torque limiter — Trq_MaxEngineManTab1/2, the automatic and the E85 equivalents. Table 2 gives a noticeably lower ceiling. |
| View in overboost | As T7, gated on TrqLimCal.EnableOverBoost. | Torque limit from TrqLimCal.Trq_OverBoostTab. |
| Firmware limited (400/350 Nm) | As T7. | Cap of 4000 / 3500 (0.1 Nm units). |
| Torque from nominal map | TrqMastCal.Trq_NominalMap, converted from 0.1 Nm to whole Nm. | As T7. |
| Gear | Undefined, First … Sixth, Reverse. Manual only. | Row in TrqLimCal.Trq_ManGear. |
| Torque efficiency (%) | As T7. | As T7. |
T8 has no ambient-pressure input — there is no turbo speed limiter in the T8 chain.
T5 inputs
| Input | What it is | Effect on the result |
|---|---|---|
| Turbo | Stock, GT17, TD04 15T, TD04 19T, GT28BB, GT28RS, GT3071R, HX35w, HX40w, S400SX3-71. | Selects the torque-vs-boost table. This is the dominant input on T5: the whole torque curve is a lookup on WOT boost in this table, so picking the wrong turbo scales the entire result. Some entries share a table (GT28BB/GT28RS use the TD04 19T table, HX35w uses the GT3071R table, S400SX3-71 uses the HX40w table). Torque is interpolated between 0.2-bar breakpoints, extrapolated linearly below 0.2 bar and held flat above 2.0 bar. |
| MAP sensor | 2.5 / 3.0 / 3.5 / 4.0 / 5.0 bar. | Multiplies the raw boost map values by 1.0 / 1.2 / 1.4 / 1.6 / 2.0 to get real kPa. Must match the sensor actually fitted — get this wrong and both the boost table and the whole power curve are off by that ratio. |
| Automatic gearbox | Read the automatic boost map. Disabled if Tryck_mat_a! is absent. | Uses Tryck_mat_a! instead of Tryck_mat!. |
Output curves
| Curve | ECU | Notes |
|---|---|---|
| Power (hp) | all | torque × rpm / 7024, integer, metric hp. Peak reported in the summary. |
| Torque (Nm) | all | Peak reported in the summary. |
| Injector DC (%) | all | Displayed clamped to 100 %, but a computed DC above 100 % still richens the target lambda before clamping — a flat 100 % line means you are out of injector. |
| Target lambda (×100) | T7, T8 | 1 / VE × 100, scaled up when injector DC exceeds 100 %. |
| Fuel flow (l/h) | T7, T8 | Hidden by default. |
| EGT estimate (°C) | T8 | Hidden by default. Only when ExhaustCal.T_Lambda1Map exists. |
Limiters
When any limiter clips a cell it is named in the table’s corner marker and, for the WOT column, in the summary line as an RPM span. Possible limiters: engine torque, E85 torque, E85 auto torque, gear torque, overboost, airmass (knock), turbo speed, fuel cut. When both a torque limiter and an airmass limiter apply, the reported one is whichever clipped last (airmass wins).
Section 2 — Street dyno from log
Load a recorded log (.t5l, .t7l, .t8l, .csv, .bpl) and the tool extracts the WOT pull from
it and adds measured curves to the graph.
How the pull is found
Signals are picked per ECU:
| ECU | RPM | Speed | Preferred speed | Airmass | Throttle |
|---|---|---|---|---|---|
| T5 | Rpm | Bil_hast | — | — | Medeltrot |
| T7 | ActualIn.n_Engine | In.v_Vehicle | In.v_Vehicle2 | MAF.m_AirInlet | Out.X_AccPedal |
| T8 | ActualIn.n_Engine | In.v_Vehicle | In.v_Vehicle2 | MAF.m_AirInlet | Out.X_AccPos |
On T7/T8 In.v_Vehicle2 is preferred when it is present in the log, because In.v_Vehicle is the
left front (driven) wheel — wheelspin corrupts dv/dt there, while the rear wheel does not spin.
If you can, log In.v_Vehicle2. The channel is sanity-checked first: if it never varies or
disagrees with In.v_Vehicle by more than 20 % (dead rear ABS ring), the tool falls back to
In.v_Vehicle instead of plotting a ~0 hp curve off a dead signal.
The tool then scans the log for every segment where the engine keeps pulling. When the throttle
channel is in the log, “pulling” means at (near) full pedal — at least 85 % of the log’s own
top throttle level, so the per-ECU scaling doesn’t matter — with a smoothed RPM slope above
120 rpm/s, which keeps slow 4th/5th-gear pulls. Without a throttle channel the slope threshold
alone has to separate pulls from brisk driving, and is stricter: 250 rpm/s (which rejects tall-gear
pulls — log the throttle signal). In both cases dropouts of up to 0.5 s are tolerated and there is
a hard break whenever RPM falls more than 300 — so a gear change or a lift is never bridged.
A segment must span at least 1000 rpm or it is dropped; if none survives you get “no WOT pull
found”. Every found pull appears in the selector under the buttons, e.g. Pull 1: 2400-5900 rpm, 8.4 s, along with an Average of N pulls entry when there is more than one.
Practical consequence: one clean pull in one gear, full throttle, several seconds long, on a flat road. The longer and higher the gear, the better — more time per RPM point means less noise in the derivative. Everything else in the log is ignored, so it is fine to record a whole drive.
Inputs
| Input | What it is | Effect on the result |
|---|---|---|
| Vehicle mass incl. driver (kg) | Total moving mass: car, fuel, driver, passengers, anything in the boot. Default 1500. Values ≤ 100 fall back to 1500. | The dominant term. Power scales essentially linearly with it — 10 % too light is ~10 % too little power. Weigh the car if you care about the number. Note the model ignores rotational inertia (wheels, drivetrain), so mass is where you’d absorb it if you calibrate: a slightly higher figure than the kerb weight is not wrong. |
| Drivetrain loss (%) | Wheel → crank correction. Default 15. Values < 0 or ≥ 90 fall back to 15. | Everything measured happens at the wheels; this divides by (1 − loss/100) to get crank power. 15 % is the usual FWD manual figure; automatics are higher. Straight scaling: 15 → 20 % adds about 6 % to the number. This is the single most arbitrary input — keep it constant between runs so comparisons stay honest. |
| Drag coefficient (Cd) | The car’s drag coefficient. Default 0.31. Negative values clamp to 0. | Together with frontal area it forms the aerodynamic drag term, 0.5 × 1.225 × Cd × A × v³. Grows with the cube of speed: negligible in 2nd gear, worth real power at 200 km/h. Set it to 0 to see how much of your curve is drag. A 9-3 is about 0.28–0.32, a 9-5 about 0.29–0.31; roof racks, a lowered ride height or an aero kit move it. |
| Frontal area (m²) | Projected frontal area of the car. Default 2.1. Negative values clamp to 0. | Multiplies Cd in the drag term above — only the product Cd × A matters, so if you know your CdA figure directly, enter it here and set Cd to 1. Around 2.1 m² for a 9-3/9-5, ~2.0 for a 900. |
| Rolling resistance | Rolling resistance coefficient Crr. Default 0.012. Negative values clamp to 0. | Crr × mass × 9.81 × v — a small, roughly constant power drain (a couple of kW). 0.010–0.015 covers normal tyres on tarmac. Low impact; leave it alone unless you’re chasing the last percent. |
| Load log | Pick the log file. | Extracts the pull and adds the measured curves. |
| Clear log | Drops the loaded pull. | Removes the log curves and leaves only the binary estimate. |
The estimate side’s E85 fuel and Torque efficiency (%) options also feed the log’s airmass curves (see below); nothing else from section 1 affects the measured curves.
The math
For each RPM point on the estimator’s axis, every log sample within ±250 rpm of that point is
collected (at least 3 needed, else the point stays blank). A least-squares fit of speed against time
over that window gives acceleration a and mean speed v̄, then:
P_wheel  = mass·a·v̄  +  ½·1.225·Cd·A·v̄³  +  Crr·mass·9.81·v̄
P_crank  = P_wheel / (1 − loss/100)
torque   = P_crank · 60 / (2π · rpm)
power    = torque · rpm / 7024          (hp, metric)
RPM points the pull does not cover stay NaN and are simply not drawn.
Output curves
| Curve | Notes |
|---|---|
| Log power (hp) | Measured, from dv/dt. Peak reported in the summary. |
| Log torque (Nm) | Measured. Peak reported in the summary. |
| Log air power (hp) | Hidden by default. Only when the log contains MAF.m_AirInlet. |
| Log air torque (Nm) | Hidden by default. Same condition. |
The two air curves are not a measurement of acceleration — they push the logged airmass through
exactly the same torque model the estimate uses (airmass / 3.1, ×1.07 for E85, × the high-RPM
roll-off, × your efficiency factor). They answer a different question: “given the air the engine
actually got, what should it have made?” Comparing them against the dv/dt curves separates an airflow
problem from a spark/fuel problem — if air torque matches the estimate but measured torque is well
below both, the engine got the air and did nothing with it.
Because these curves reuse the efficiency factor, the useful workflow is: get one good pull, then adjust Torque efficiency (%) until Log air torque lines up with Log torque. From then on the binary estimate is calibrated to your car.
Accuracy, honestly
This is a coastdown-free inertia dyno with hand-entered constants, so:
- Absolute numbers are only as good as mass, drivetrain loss and Cd × frontal area. Two of the three are guesses.
- Relative numbers are good. Same car, same road, same gear, same inputs, before and after a change — that comparison is meaningful, which is what most tuning actually needs.
- Any road grade shows up directly as power. Use a flat road, or run both directions.
- Wheelspin, a slipping clutch, a torque-converter automatic, or a gear change inside the window all corrupt dv/dt. The pull detector rejects gear changes; it cannot see slip.
- The model has no rotational inertia term, which makes low gears read low. Use the tallest gear the road allows.